Consider the principles of urban planning, employment activities and population density with respect to their potential impact on travel needs have a direct impact on car dependencies and reduction of greenhouse gas emissions. City planning has a limited impact on reducing greenhouse gas emissions for a brief time period, as the necessary infrastructure is under process, but reliance on private cars for public cars and other environmental issues.
The combination of high housing and employment densities can impact shorter commuting distances and reduced car use if supported by well-organized public transport and suitable financial and compliance measures. Considering the tools acquirable to lower the greenhouse gas emissions from transportation, city planning is just as important in controlling emissions from the transportation sector.
Transportation on Climate change
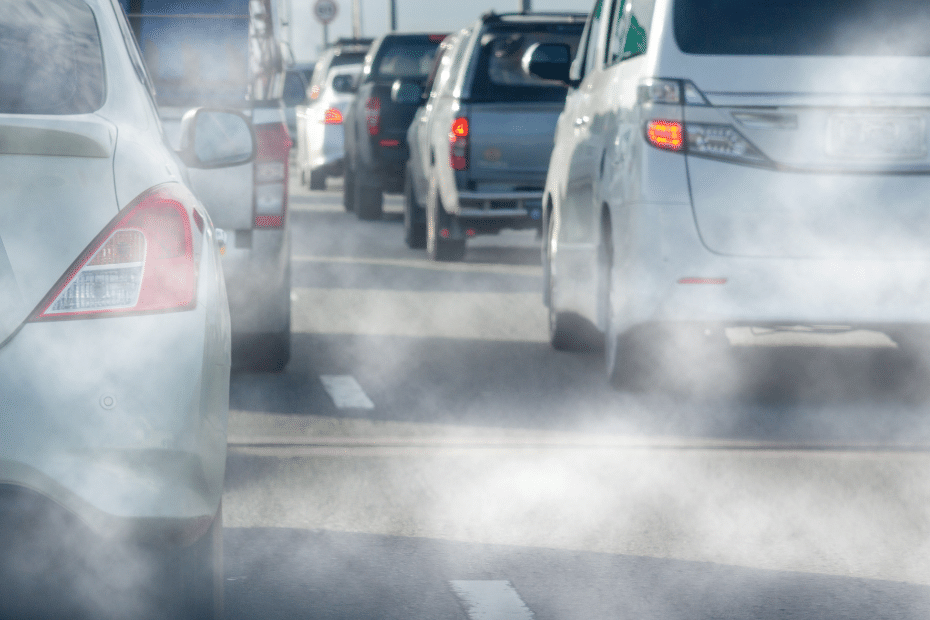
Anthropogenic activities have resulted in an alarming increase in greenhouse gas emissions during the last few millennia and the highest have been recorded in the past few decades. Climate change has been detected to have the maximum catastrophic effects since the 1950s, from warming of the atmosphere to melting of glaciers and increasing sea levels. A major contributor to GHG and carbon dioxide emissions that lead to climate change is the transportation sector. Hence there is a dire need to mitigate the effects this field has on the environment before it is irrevocable.
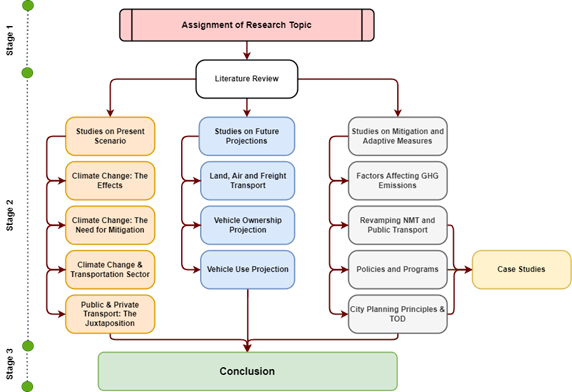
A fixed methodology has been followed for researching the given topic, and the structure is as shown below in the flowchart. The methodology has been divided into 3 stages.
Stage 1: Assignment of Research Topic
Stage 2: Literature Review under the heads,
- Present Scenario
- Future Projections
- Mitigation and Adaptive Measures
Stage 3: Result and Conclusion
Present Scenario of Climate change & Transportation Sector
Climate Change: The Causes and Effects
A few of the major events that throw light on the grim state of climate change were the Australian bushfires of 2018 and 2019, the Hurricane Dorian in the Bahamas, which caused widespread devastation and was the most intense wind speed detected in the Atlantic Ocean, and the Kerala floods of 2018, due to unusually intense rainfall during monsoon season, which was the worst flood recorded in this South Indian country in over a century.
These are only a handful of the many disasters that we have seen in recent times and there will be many more such events in the future if we do not take strict actions now regarding the causes of climate change.
Carbon Dioxide Emissions Rise: The Keeling Curve
The increased level of carbon dioxide emissions into the atmosphere is best portrayed in the Keeling Curve graph (Figure 2), taken from the Mauna Loa Observatory in Hawaii, from which we can infer the atmospheric levels of carbon dioxide has been increasing steadily for decades. This is the major cause of climate change observed in recent years, as a result of which we observe rising temperatures. Although there was a pause in the increase in the middle of the century, the average global temperatures have only been on the rise, which is more than 1 deg. C. over pre-industrial levels now (IPCC, 2014).
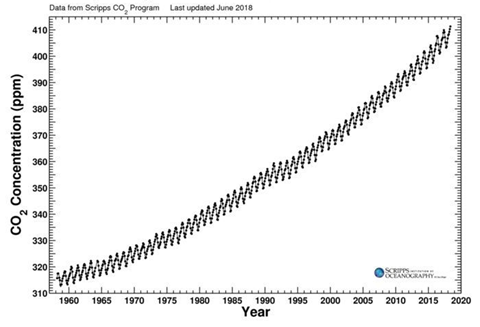
Source: Scripps CO2 program
The rise in other GHG Emissions
The supreme cause of climate change has been detected to be the rise in levels of greenhouse gases in the atmosphere, which will have the most effect on warming by the middle of the twentieth century. The added problem is that a large percentage of these gases remain in the atmosphere (about 40%), while only a small portion is removed by plants, soil and ocean; but absorption of GHG emissions by the ocean also induces ocean acidification.
From Figure, it is observed that while there has been a 1.3% annual increase of GHG emissions per year from 1970 to 2000, there was an increase up to 2.2% from 2000 to 2010 (IPCC, 2014). The major contributor to this value is the carbon dioxide that is emitted from fossil fuel and industrial processes. The main causes of this increase are said to be population and economic growth. While there has been an almost similar contribution from population growth in the last three decades, the percentage share of economic growth has increased manifold.

Source: Climate Change 2014 Synthesis Report Summary for Policymakers
Moreover, there are concerns regarding certain tipping points in the climatic environment which may offset changes of their own, which will eventually prevent us from having any control over the emissions. An example of this phenomenon is the melting of permafrost in northern latitudes, which sets methane gas emission which in turn melts more permafrost. This is only one example of possible positive feedback cycles in the climate system that add more risks.
Climate Change: The Need for Mitigation
The above-presented scenario makes us realise the need to prioritize lowering greenhouse gas emissions in order to limit global warming to 2 degrees Celsius or less, which was the goal of the Paris Agreement of 2015.
However, the longer we wait, the faster the need will be the rate at which we need to decarbonise. If the mitigation measures had started in 2020, the rate of mitigation would have been 6% per year but had we started it in the year 2000, the rate required would have been a significantly lesser 2% per year, for a chance of 66% of staying below the 2 deg. C. rise in average global temperature.

Source: CICERO Center for International Climate Research
Climate Change & Transportation Sector
Globally, the transportation sector, which forms the backbone of development in most developing and developed nations, is responsible for CO2 emission, and the rapid pace of growth of this sector is expected to increase twofold by the middle of the century. The number of light-duty vehicles is also set to rise, with more contributions from developing countries like India and China. There has also been an increase in the number of cars that are heavier and SUVs that are more polluting, thereby increasing the emissions per passenger mile, over the last 20 years.
Future Projections of Transport sector on Climate change
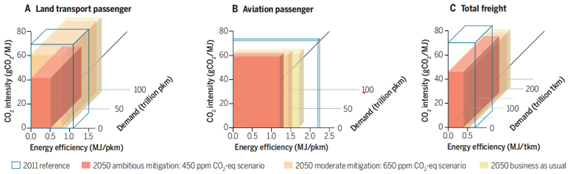
Source: Privitera, Riccardo, 2021, Climate Change Management through Adaptation and Mitigation
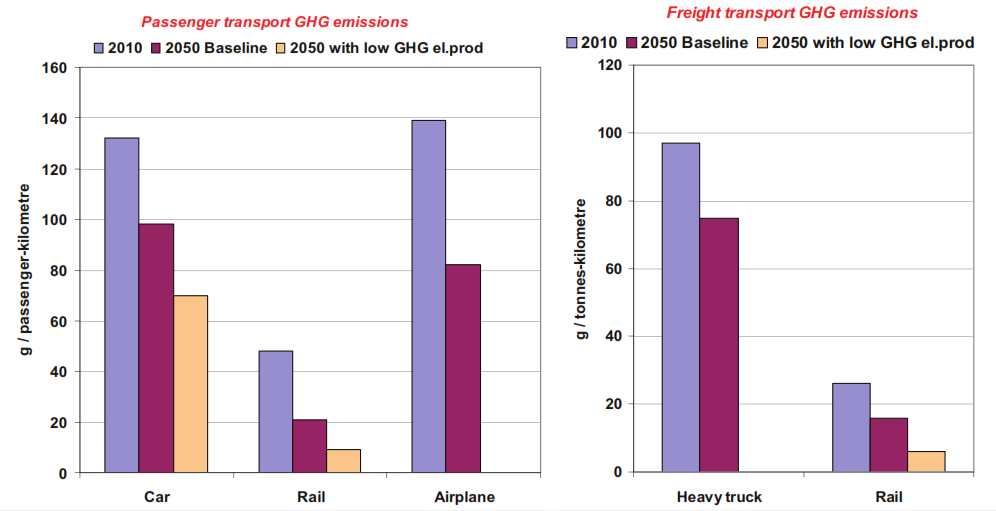
Figure aims to address the main challenges of the transport sector’s implementation in 2050, which are summarized through three representative scenarios. We then identify additional mitigation options that can be utilized to meet the goals set by the IPCC. Passenger car is mostly responsible for the highest emission of CO2 when compared to other transport. Whereas, emission from aviation is increasing day by day with its fast speed and rapid faster mode system.
Factors affecting GHG Emissions

Source: Wright, 2005
The source component of traffic emissions offers countless opportunities for reduction. Many national and international efforts to reduce emissions focus on one of the more than 20 sub-components of this equation, the “fuel type” and the countermeasure package. As per Figure 6, there are 3 aspects that govern emissions per mode – behaviour, design and technology. Behaviour broadly represents the relative market share of different modes of transportation and their respective load factor.
Load factor is the number of passengers carried by each vehicle. The sub-components in this category are intended to influence consumer behaviour and personal travel choices. The factors that influence greenhouse gas emissions coming from design-related aspects of the transport sector are governed by distance travelled, land use controls and network design. In addition, the advent of new information and communication technology (ICT) offers the potential to reduce the number of trips.
The last category in Figure 6 is related to the technical attributes that affect vehicle emissions per mileage. Great attention has been paid to the carbon content of fuels used to reduce emissions.
Mitigation and Adaptation

Source: Privitera, Riccardo, 2021, Climate Change Management through Adaptation and Mitigation
Actions related to green infrastructure, buildings, city planning, energy systems, and transportation can provide particularly co-benefits. There is consensus that both adaptation and mitigation are needed to address the effects of climate change, but to effectively maximize their potential, we need to better understand their interactions.
Mode Sharing
According to forecasts, it is not possible to reduce overall GHG emissions by the transport sector through technology alone. Technology can reduce GHG emissions for all travel modes but it will not make much effect given that vehicle ownership and vehicle use is projected to increase in the future. (Refer Figure 8). Hence it is vital to increase the mode share of public transport options.
In 2011, European Union published a report on its vision for a long-term sustainable transport system, with the goal of reducing transport-related emissions. A follow-up study estimates reductions in Europe’s GHG emissions by 2050, if there is a partial mode shift to railways, after applying the world’s “best practices” to rail infrastructure. Using new technology solutions, it is conceivable to cut CO2 emissions by 25-40% for vehicles, trucks, and aircraft by 2050. On the other hand, a partial shift to best practices rail system could increase this percentage to 40-50% as seen from the Figure 8.
Source: Jain, 2015
This is one such example that demonstrates how mode shift to public transport is the need of the hour to reduce transport sector GHG emissions.
Load Factor and GHG Emissions

Source: Zito, Rocco, 2019, Modelling the impacts of transport policies,
Load trip rates are primarily affected by quantity and demand characteristics such as shipping size, product type (density), just-in-time practices, while empty trip rates are affected by physical trade imbalances.
Public Transport in Developing Nations
A country runs because of its transport sector. Civilised life depends on transportation for both the movement of goods and the movement of people. Passenger transport in developing countries relies heavily on cars. Most of the operating buses run empty, causing both financial losses and unnecessary traffic congestion. With this scenario, it is vital to discuss the issues related to public transport in developing countries, and how such issues could be addressed.
User’s Reluctance to Use Public Transport
A study, published in the Journal of Transport Geography, surveyed people in urban areas of India and China and concluded that public transport usage had developed “a very strong and negative attitude” in both countries. As per Census 2011, about 15% of the population uses public modes for travelling to work, while 22% prefer walking. Figure 10 shows a modal split in India.

Source: Census 2011
Certain reasons could be attributed to this trend. Firstly, professionals who believe that riding a bus could hamper their business and marriage prospects. The idea of vehicle ownership gained momentum in 21st century and now owning a vehicle is a status symbol. Most of our public choices depend on how we want to be perceived by others.
Secondly, supporting design and infrastructure like provision of parking, feeder services, networks and available choices of public transport matter a lot in order to address economic and social disparity. With rising income levels, people desire a sense of comfort while travelling, and changing modes midway to reach a destination is a big hindrance. Furthermore, implementation of land use regulations matters a lot to direct trip generation within the city. Transport oriented planning guide development in most Asian developing cities but they have weak land use control systems, leading to urban sprawl, traffic congestion, parking problems and pollution.
Thirdly, poor connectivity poses a hindrance to many urban public transport examples in India. Many times, BRT systems do not connect all the areas of an urban region, causing modal split variations within the region. There are delays and huge time gaps. The lack of frequency due to low demand, further leading up to a smaller number of users. As a result, bus operators incur huge losses.
Revamping BRT System
The majority of successful BRT systems are planned as part of a well-integrated master plan that includes both a land use strategy and a transportation system. Land use policy, road network architecture, and other public transit systems should all work together to provide well-defined bus routes along exclusive busways. There are many ways to make BRT systems successful.
By revamping the system design model, rapid transit operations can be attained by increasing the Level of Service of roads. There are many ways to improve LOS, some of them being- road widening, lane segregation for bus routes, well-designed transit stations for quick alighting and boarding, weather protection along the whole process of mode-shifting, and availability of feeder and parking services.
Boarding could be made better and faster by asking passengers to pay their fare at the stations themselves and be able to enter the vehicle at platform level via multiple doors an “Entire Network Perspective” must be considered for network design.
Marketing strategies such as a logo or theme, captivating aesthetic elements or materials complementing site location, stations, and vehicles should be employed to attract users. A BRT should play a vital role in everyday transactions between various user groups, and must be designed accordingly. Awareness campaigns could be conducted in stations, summer camps, and traffic conferences.
The public should be engaged by requesting regular feedback of their travel experience. Mobile apps could be integrated with BRT system to make ticketing, information availability and feedback submission easy for users. Real-time update screens should be installed in buses. To put it another way, riding a BRT system should provide a sense of familiarity similar to that of riding a metro train.

Source: Xiaoyan Li, 2018
Case Studies
Following the previous discussion about revamping public transport, this section tries to understand the extent of these solutions in creating self-sustainable public transport. Whether it is the successful implementation of the BRT system in Bogotá or new proposals to stop traffic congestion in Gangtok by introducing the Ropeway system or the BRT project plan of Bangkok, following case studies are good examples to understand the dos and don’t when it comes to Sustainable Urban Mobility Plan and public transportation sector.
Bogota
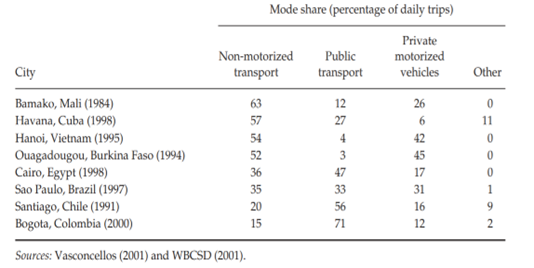
Figure 12 below shows urban transport mode share in various developing cities. Bogota in Columbia has shown a shift in mode share from private vehicles to lower polluting modes including BRT system and other non-motorised transport choices. The urban transformation of Bogota has demonstrated how innovation in low-cost, low- technology mechanisms can reduce transport emissions. Consequently, it shows how appropriate policy decisions and raising user awareness is a crucial step to holistically implement any mobility plan.
Table 1: Mode share in urban transport in various developing cities
Source: Wright, 2005
Some salient features of the Bogota BRT system are -exclusive right of way lanes for buses to improve travel time and reduce obstructions, improvement in connecting commercial activities and infrastructure, rapid station transactions, and free mode transfers between routes (like in metro rail design), fare collection at stations.
Moreover, availability of clear and real-time information is available at all times. Modal integration, with proper feeders, and last-mile connectivity is well thought of while designing the network. The vehicles are neat and clean. Stations are well-lit, clean and enclosed to make them weatherproof. Finally, there is extensive marketing and consumer service integration, which can be accessed easily through apps.
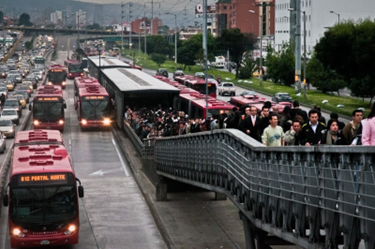
The biggest challenge in urban mobility planning is how one changes behaviour. After transforming public policies, it is important for people to collectively accept that the world is changing. Bogotá’s success with BRT is also due to the strict implementation of car-restriction measures. About 2 million people participate to celebrate Car-free Sundays in the city. Such high level of community participation helps in spreading awareness of sustainable lifestyles.
There are some measures to reduce on-street parking and previous parking bays have been converted into attractive public interaction spaces. There are pedestrian zones acting as feeders to the BRT systems. Also, programs such as car-free weekday, not just cut the GHG emissions for that day but also raises awareness about eco-friendly travelling (Figure 13). Hence, we understand that Bogota’s BRT has become a success not just through design but implementation and changing user behaviour too.
Now comparing this trend with China’s rapid adoption of the car. Trends show that by 2004, the country’s annual growth in car ownership crossed 75%, and inevitably bicycle use fell. This is because China’s national policy favours the automobile industry and provides incentives and subsidies to private vehicle owners.

Gangtok
Coming to the case of Gangtok, a thriving Himalayan city in the Indian state of Sikkim, we see a very different scenario than the one discussed above. Currently, there is a high volume of pedestrian traffic in the various Central Business District areas spread out in the city. This is due to the concentration of commercial activities in selected areas of the city as a result of poor land use and zoning control by the authorities.
Being a tourist city, a high tourist influx is observed in the months of March-June and Oct-Nov, causing a disproportionately high travel demand. Majority of locals and tourists prefer walking for shorter trips. The city’s pedestrian population accounts for roughly half of the entire demand for mobility inside the city. On all main highways, there are pathways that are safe and separated from traffic, although during the high season for tourism, the width of these footpaths is insufficient.

On the other hand, shared cabs running throughout the city, take up another 15% of modal split. However, due to concentration of major activities of city at city centre, there are more trips to the CBD, causing traffic jams in these locations. Presently there are no traffic lights in the city, and until past few years Gangtok traffic had been effectively controlled by traffic police. But things are changing due to rising immigration from surrounding villages and increasing population growth. Moreover, there has been a rise in vehicle ownership ever since Sikkim came under the governance of India in 1975. Only now has some proposals been drafted for the future of the city.
Some proposals by the concerned department (UDHD) of Gangtok to combat the issues discussed above are discussed as follows:
- Shifting and decentralization of work centres.
- Adjustment in work timings
- Policy Changes: The necessity for a transport strategy that will specify the system of fiscal incentives, concessions, and obligations that will be placed on public transport providers in the city in order to make the operations possible and the services user pleasant.
- City expansion is being considered.
- Considering Ropeways as local transport network.
- Alterations to the usage of the land and the densification of corridors along the paths of mass ropeway transit should be made wherever feasible.
Developing NMT Infrastructure
Challenges for NMT in India
The road infrastructure everywhere in the world has been designed for motor vehicle users primarily- and this is the main problem of the transportation sector, in terms of emissions, pollution, energy usage and accidents. In this regard, non-motorised transit (NMT) needs to play an even bigger role while developing the road network, bringing to the forefront the most sustainable aspects of transport modes, walking and cycling. There is a need to promote and encourage NMT usage to diversify the options presented to the user for travel choice, especially for shorter trips.
Lack of investments lead to NMT travellers having to use motor carriageways, which puts them in unsafe conditions of travel. This reduces the number of people who use these modes, even for relatively shorter trips, thereby increasing dependency on private vehicles. Hence, the main requirement is proper NMT infrastructure in developing countries.

Source: UNEP, November 2010
NMT Guiding Principles
An interconnected network allows users to choose NMT due to reduced walking distance by providing direct connections. This presents an attractive alternative by saving time when compared to motor vehicles. This is in direct relation to the Nudge theory, where indirect suggestions are made to influence the decision of individuals.
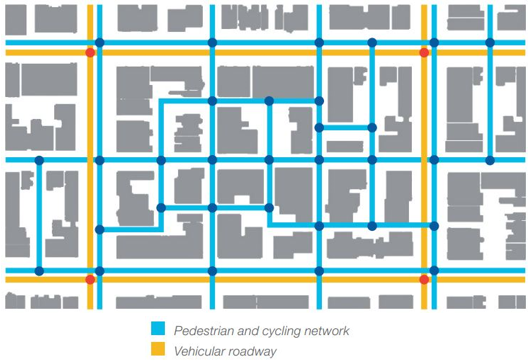
Source: IBI Group (2016), NMT Guidance Document
There needs to be an equitable distribution of R.o.W. among all the modes, and this includes NMT as well. By providing specific routes for walking and cycling, the safety and security of the NMT users.

Source: IBI Group (2016), NMT Guidance Document
Walkability can be improved by increasing the quality of the neighbourhood and also at the same time offers a high level of priority to pedestrians. These lanes can also provide comfort by having trees planted to offer shade.
Source: IBI Group (2016), NMT Guidance Document
Policies to Reduce Carbon Emissions in Transportation Sector
The following chart represents the interrelation of the 3 sectors: transport, development and climate. The way forward is to understand the dependencies these fields and ensure that the policies proposed are in line with this vision.
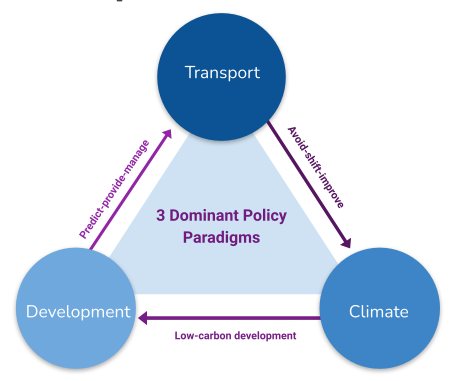
Source: Stefan Bakker, Mark Zuidgeest, Heleen de Coninck & Cornie Huizenga (2014)
The Policy of Carbon Pricing
Carbon pricing or Emissions Trading Scheme (ETS) is a way to put in terms of cost the effect of GHG emissions on the environment. This is mainly done to incentivise low carbon growth. Implementing carbon price in the field of transportation would encourage people to understand the effect of vehicles in climate change and to shift to more sustainable modes.
Taxes & Increased Parking Charges on Private Vehicles
There can be heavy taxes implemented on the purchase of conventional vehicles while at the same time reducing taxes on e-vehicles. Parking is an issue that is prevalent in developing countries like India, induced due to high density development, improper off-street parking facilities etc. There can be heavy taxes on parking of private vehicles in the CBD area, and the distance to off-street parking facilities can be increased so that users will be forced to diversify their mode preference to public transport and NMT.
Electrifying the Transport Sector
Electrifying vehicles are considered the way forward in the transportation field, although the opinion is divided.
- The aviation industry can plan to electrify short-haul flights and can be asked to compulsorily declare the climate impact of their long-haul trips
- Incentivising automobile industries to produce and users to purchase more electric vehicles can be implemented.
- Citywide plans to have only electric public transport is a viable policy to adopt, a prime example of which is Santiago, Chile where there are 386 electric buses plying and plans are in action to have only electric buses plying by 2040.
City Planning Principles and Transportation
Urban space is the result of various physical and socio-economic factors driving the city. The rationality of its design affects the enjoyment of work, life and leisure activities undertaken by the users. And so urban planning decides whether transport sector would be a success or not as it plays a crucial role to govern the spatial distribution of source and destination and the choice of travel mode. However, determining the kind of spatial development that may minimise the amount of time and distance spent commuting and, as a result, the amount of emissions produced is a topic that has been and should continue to be the subject of substantial research.
Sustainable urban mobility prioritizes accessibility in creating a better life for people and the environment throughout the long haul. Good urban planning fully utilizes all existing infrastructure and considers pedestrians and bikes to attain barrier-free design. The plan should accommodate new modes of mobility with suitable locations for them, thereby enabling people to travel around the city. The chart (Figure 23) shows various verticals that must be considered while preparing a mobility plan.

Source: UN-Habitat, 2013
Transit-Oriented Development
Following the principles of TOD, the Urban economy is directly related to Transport. It has been observed that when mixed and denser settlement is promoted in an urban area then it leads to more land value taxation which result promotes the use of public transport and less CO2 emission.

Source: Felix Creutzig, 2020, Transport, IPCC
It has been observed that factors like employment, dispersed population and lower density development govern the driving principle behind vehicle usage and transport. As per most European countries, there is a lower level of private vehicle usage in places which has higher density and a more centralized land usage system. TOD leads to a reduction in travel demand, as there will be shorter and fewer car trips in the high-density development area. And will eventually use more public transport as compared to low-density areas.
Polycentric Development
Polycentric urban design is often regarded as the optimal kind of urban spatial layout because of its ability to advance social, economic, and environmental objectives. The use of polycentric planning may help reduce the amount of time spent commuting.
A study was conducted to explain the role that polycentric planning plays in reducing travel time. The co-location hypothesis was developed as part of this study, and it claims that businesses and residents can avoid traffic jams and high land prices by continually adjusting the locations of their residential locations to achieve a balance between employment and accommodation. This thereby reduces commuting distance and time. The proposals by the Gangtok administration also focus on this concept to reduce traffic congestion. Some aspects that accompany polycentric planning are:
- Compact development.
- Encouraging walkability
- A diverse range of uses
- Inclusivity
- Environmentally responsible
- Secure and just
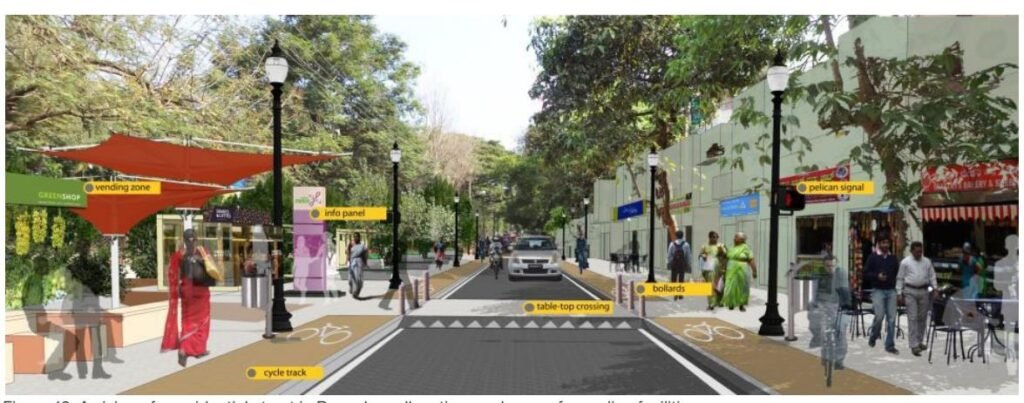
If we try to understand how a BRT system could function in a polycentric design, it will be evident that the network design becomes easy to implement in this model. Figure 21 shows various facilities that accompany a well-designed BRT system superimposed in a polycentric spatial model.

Source: Xiaoyan Li, 2018
Conclusion
As one of the measures, employment density and increasing population near transport hubs can lead to a decrease in transport ownership. Urban planning can help overall when it comes to reducing GHG emissions and their adverse effects. It can lead to the promotion of public transport and vehicle ownership eventually. Zoning measures can be highly effective when it comes to high employment density and high population growth is responsible for the dependency level on the car.
The combination of high density and high population results in an increase in the cost of owning a private vehicle and requires better public transport passengers. In combination with efficient public transport routes, urban settlements for future growth may be effective as not only will it reduce traffic and private car use, but will also reduce the distribution of GHG emission reductions and welfare equalities.