
Let’s examine the relationship between government policies and the real estate market using case studies from India. Government policies and the Indian real estate market are not as widely researched as the real estate sector’s connection to the economy as one might expect.
Given that the real estate industry is linked to the overall performance of the economy, and that variations inside this sector can amplify highs and lows in the overall economy, it is crucial to examine the topic to demonstrate how policy change would affect the real estate sector and the overall market. Research shows that government policies have a significant impact on the real estate market.
The majority of the approximately one hundred laws and development policies controlling various parts of real estate trace all the way back to the nineteenth century. Despite the increasing number of regulations, the Indian real estate market looks to be far from adequate, and significant revisions to existing laws are necessary to bring them into compliance with modern-day standards. Let’s examine several import policies and their impact on the Indian real estate market.
Development Policy
The influence of development policies on real estate in metro areas constitutes of three exclusive elements i.e., Development Policy, Real Estate and Metropolitan Areas; and their relationship with one another. To understand the interdependency of these entities, it is important to understand them individually and how they have evolved over the years as per the changing need of the period.
Development Policy can be defined as plans or actions that aims to encourage development under various domain. Example- To eradicate poverty, economic upliftment, sustainable development, social well-being.
To simplify the various domains under development policy, it has been categorized under the following categories-

Source – Author
- Social Development Policy is concerned with the ways societies meet human need such as education work, etc. Example- Land redistribution Policy, National Education Policy, 1957.
- Economic Development Policy aims at improving the standard of living. Example- Real Estate Regulation and Development Act, 2016.
- Human Development Policy aims at maintaining and improving human capital in society. Example- The Aatmanirbhar Bharat Rojgar Yojana, 2020.
- Environmental Development Policy aims to improve human welfare. Example- National Water Policy, 1987.
History and Evolution of Development Policy
(Addison, 2004)
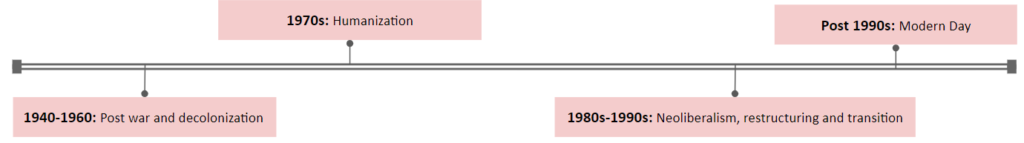
The history of development policy can be traced back from the Post war and decolonization in the 1940s-1960s which marked the declaration of Human Rights. Few of the programmes that were implemented during this era were Bilateral loans & grants, food and community aid.
Following this came the Humanization era in 1970 which witnessed the rise in oil prices and economic contraction with the eradication of rural poverty as its main challenge. Working upon this challenge, the programmes implemented during this era were Capacity development, Rural development, etc.
Then came the Neoliberalism, Restructuring and Transitioning period of 1980s-1990s which marked the crashing of the economy and the potential collapse of the state due to debts. Civil Society and NGOs were seen as the key development actors during this period. Then came the Modern Era (Post 1990s), which marked the introduction of eminent policies such as Human Development Index, Education for All (1990), etc.
Hence, it can be observed from the timeline how the policies emerged and evolved as per the need of the period.
Indian Real estate market
Real Estate can be defined as a real property that includes anything that is permanently attached to it. The types of real estate are listed below-

Source – Author
- Residential Real Estate includes properties that are used for residential purposes. Example- Family houses, etc.
- Commercial Real Estate involves property that is used exclusively for business purposes. Example- Shops, hotels, etc
- Industrial Real Estate includes properties used for manufacturing, producing, storing and distributing. Example- Factories, powerplant, warehouse, etc.
- Land Real Estate involves the non-developed properties, empty lands and agricultural lands.
- Special Purpose Real Estate includes properties used by public such as govt. structures, etc.
Real Estate including the stakeholders constitute to what we call the Real Estate Market, which involves the following hierarchy-

(Caputo, 2013)
The Real Estate Market includes demographics, interest rates, economy, and government policies as their driving factors. Hence here, we see the intersecting relationship between Real Estate market and Development policies.
History and Evolution of Real Estate
(Kagaay, 2021)
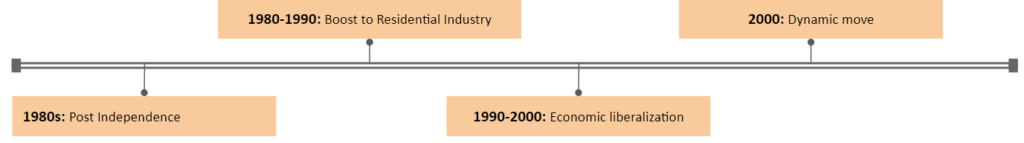
The history and evolution of Indian real estate market can be uncovered from the post-independence era when Lahore got drawn as a part of Pakistan which left a void in Punjab for a major city. Hence, this period was termed as period of new capitals for states like Punjab. Despite this, India continued to be a poverty ridden country.
However, after the successful planning of Chandigarh, increase in township were seen. By 1980, it still hadn’t experienced much activity in Indian real estate market and the individuals of the nation were still destabilized due to the misuse from the hands of Britishers and afterward by their proprietors. “The need for free partners and financial specialists were felt within the market. To boost the private industry within the nation the Central Government built up the Housing & Urban Development Company in 1970, City IndustrialDevelopment Corporation in 1971 as well as the National Housing Bank in 1988″ (Kagaay, 2021).
The period of 1990-2000, also known as the period of economic liberalization witnessed growth in urbanization, change in lifestyle of people which led to the transformation from Joint to Nuclear family. This led to the surge in rate of urbanization from 23.34% in 1980 to 25.72% in 1991. Thus, the demand rate for infrastructure hiked due to the growth in population as well as the migration of people to the town-side for better opportunities.
The period post 2000, known for its advancement in technology has played a key role in the Indian real estate market. With the rise in urbanization, new infrastructure started getting built, new concepts like that of mall came into existence giving rise to an increase in commercial structures. This introduced the Real Estate Investment Trusts (REITSs) which enabled investors with limited budget to make investments in such projects. Later, the Real Estate Regulation and Development (RERA) was established to boost the development of cities which eventually made an advantage to the buyers as well the investors. This has made the Indian real estate market a significant part of the Indian economy.
Metropolitan Areas
According to the 74th Amendment to the Constitution of India, a metropolitan area is defined as a region that has a population of 10 lakh or more than one million people, is made up of one or more districts, and consists of two or more municipalities, panchayats, or other contiguous areas. This designation must be given by the Governor of the relevant state in the form of public notification (Constitution of India, 1949). The metropolitan regions of India are shown in the following figure.
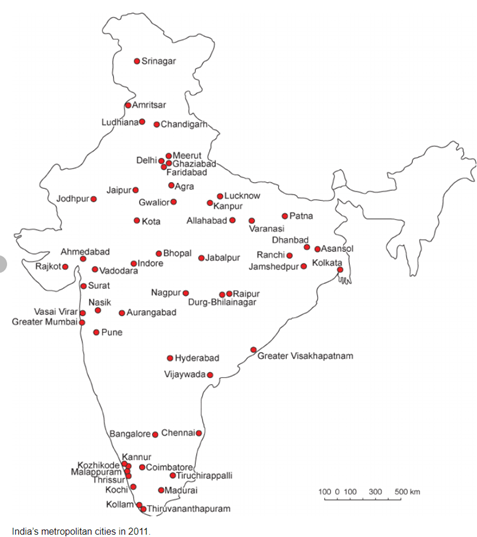
(Shaw, 2012)
Acts and policies- Impact on real estate
To understand the co-relation between Development policy and real estate, few important acts and policies along with its subsequent impact on Indian real estate market has been studied.
Land Acquisition Act, 1894
Under this Act, land was to be obtained forcefully with the aid of using the authorities and this turned into loose to determine how a whole lot is to be paid for the land. The government obtained land for functions that appeared into public area which includes town/rural planning, etc. The next effect on actual property will be visible because the act hindered rapid acquisition of land at affordable fee ensuing in price overruns.
Rent Control Act, 1949
The Rent Control Act, is one of the main reasons behind the rapid growth of Indian slums, as it has led to a serious shortage of affordable housing for low-income households. Low- and middle-income households typically live in rental housing around the world, and the need for such housing in our cities increases as the economy modernizes, labour mobility increases, and urbanization progresses. Therefore, it is necessary to increase the inventory of rental housing.

The influence on Indian real estate market of the same involved a negative effect on investment in housing sector as well as stagnation of municipal property tax revenue as it was based on the rent.
Planning Commission, 1950
The planning commission came into existence in 1950 with the introduction of the 5year plan with a focus on Growth, Modernization, self-Reliance, Equity.
The impact on Indian real estate market can be seen through rapid industrialization that started with second five-year plan which attracted many migrants where steel plants were set up i.e., Rourkela, Bhillai, Durgapur. It also led to an increase in income of people, housing demand also increased.
Export Processing Zones and Special Economic Zones
History of Special economic zones start with Export Processing Zone which were industrial estates that were enclaved from domestic tariff areas such as tariff or quota. These were located near ports and airports or from where export of goods was easier. It started in 1965 with first zone in Kandla Some special characteristics of these areas are Duty free environment for export purposes and making competitive prices and quality.
Since 2005, most of these zones have been converted to special economic zones under the Special Economic Zones Act of 2005. Example-Kandra, Santa Cruz, Surat. Some features of SEZ include tax exemption for the first five years, labour law flexibility, 100% foreign direct investment in the drug and hazardous chemical sectors, distillation, and brewing of alcoholic beverages, etc. These can be used as free trade zones, free economic zones, industrial zones, and urban business zones.
Talking about the effects of SEZ on Indian real estate market involves the development of good quality infrastructure facilities in and around the city, an increase in land rates is observed before and after denoting of such areas as SEZ and it has helped to revitalize many areas which were previously either under decline or haven’t seen growth thus resulting in a positive growth in the real estate market in these areas.
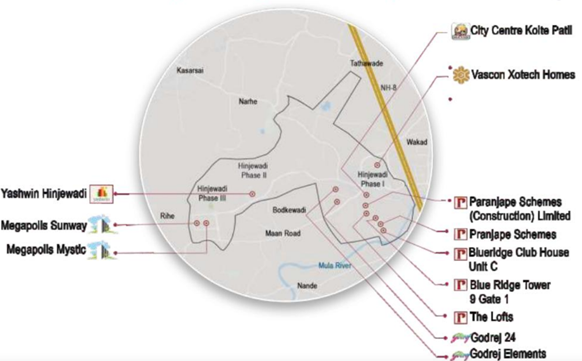
Case Study 1: SEZ of Hinjewadi, Pune
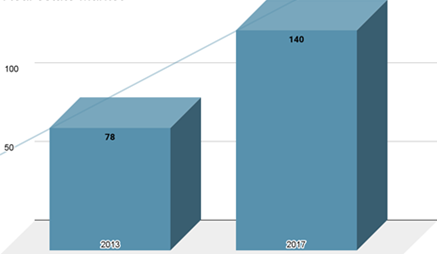
So, for our first case study we have chosen Special Economic Zone of Pune which is Rajiv Gandhi Infotech Park in Hinjewadi. This IT hub has more than 1 Lakh employees in IT industry The development of this IT Park started in the mid 1990’s with phase 1 but from that time only a few companies were present here but after the announcement of its phase 3 as a special economic zone we can see a lot more IT companies started to flock here as compared to previous phases. Which is visible in Figure 7, that in phase 3 there are lot more companies as opposed to the number of companies in phase 1 and 2.

(PROPTOQ, 2018)
As the IT companies started coming here it can be seen that the residential real estate sector also started booming with many residential complexes and societies being developed and Figure 8 shows the existing and proposed residential areas. And with the advent of commercial and residential real estate a growth in social infrastructure is seen with the opening of various schools, malls and institutes in this area which is shown in Figure 9.
(PROPTOQ, 2018)
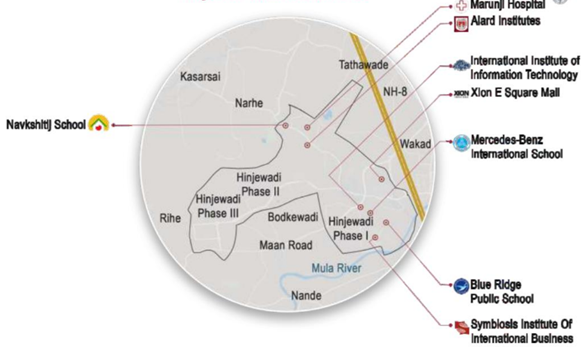
(PROPTOQ, 2018)
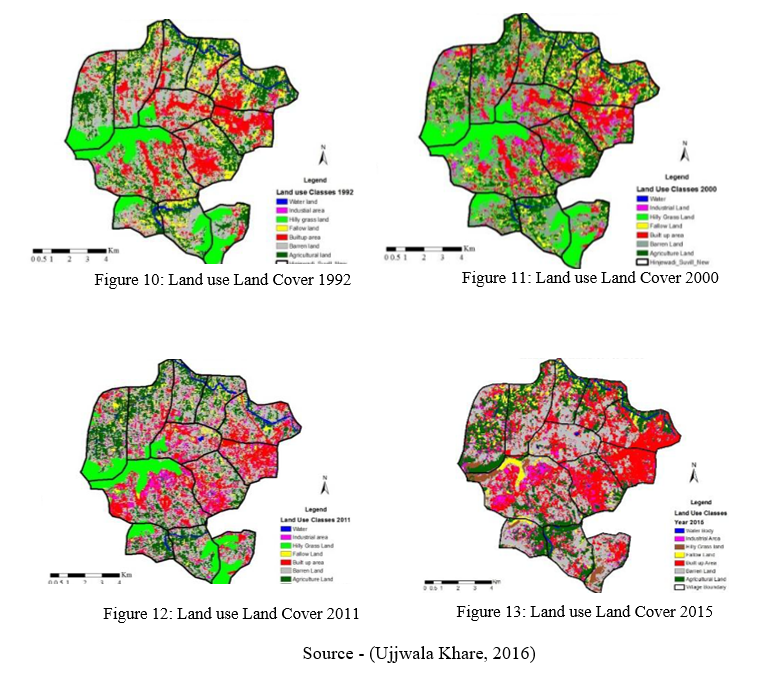
Subsequently, a land use change with the development of IT sector. In Figure 9, a good mix of agricultural land , hilly grass land and built-up area is observed. But in the subsequent years it’s observed with the rising industrial and built-up area, there is a decline in the green cover and agricultural land. A significant change in land use can be seen from 2011 to 2015. And during this period the Indian real estate market saw a boom with new residential colonies and increase in demand of commercial spaces to cater to the need of the population residing here.
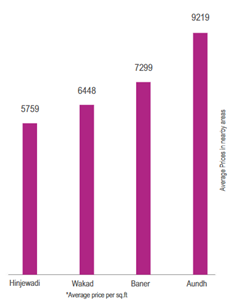
Now if we see the trend in real estate market of Hinjewadi, we can see that the prices of property here are cheap as compared to the nearby areas, Figure 14 . This is due to the saturation of these areas and proximity of these locations to Pune. And Hinjewadi being in the periphery has new projects coming up and this area is still under development so the prices are cheap in comparison to Wakad, Baner and Aundh.
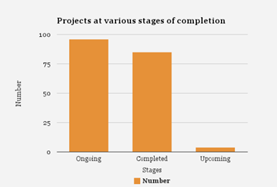

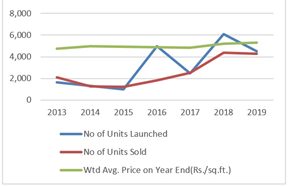
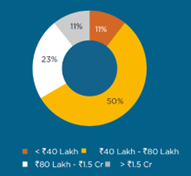
This can be seen in Figure 15, which shows many projects are still ongoing. In the residential sector the major market segment for sales is between 40 Lakhs TO 70 Lakhs which is 43.4% and 70 Lakhs to 1 crore 20 lakhs which is 42.6%. Coming to property prices, here a gradual increase in price can be seen from the year 2013- 2019. As of no. of units launched in totality this number has increased but major drop was seen after the year 2016 due to demonetization and RERA. But there was no effect in the number of units sold as this number just grew without any drops.
Looking further we can see a diverse range of properties available economically in form of apartments whereas such diversity in price range is not visible in Row houses, villas or plots. And due to a large difference in minimum and maximum price of apartment the average price of apartment can be seen on a higher side as compared to others.
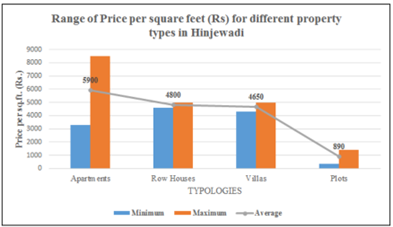
(CommonFloor, 2019)
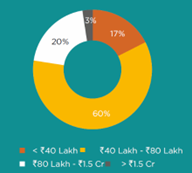
And thus, if we see the preferred property type, we can see the majority goes with apartments at 66% visible in the pie chart on the bottom right. In the rental preference the majority 60% preference is given to 2bhk property followed by 3bhk at around 30%.
So, it can be seen that after this area was denoted as Special economic zone major growth is seen in the area and in the real estate market.
Urban Land Ceiling and Regulation Act, 1976
A cap on vacant land in urban agglomerations was established by the Urban Property (Ceiling and Regulation) Act (ULCRA), which was passed in 1976. The act also allowed for the acquisition of land that beyond the ceiling limit. The aims of the Act included preventing the concentration of urban property in the hands of a small number of people, as well as preventing speculation and profiteering from it; socialising municipal land in urban agglomerations in order to ensure equitable distribution.
With ULCRA in effect, there was a limit on the amount of land that could be developed, resulting in limited land availability for building and development. When landowners were forced to sell their property to construction and development enterprises, they demanded outrageous sums. The developers had no other choice except to shift the cost onto home purchasers, resulting in a sharp increase in housing prices.
Right to fair Compensation under LARR, 2013
“A statutory act in India, the Right to Fair Compensation and Transparency in Land Acquisition, Rehabilitation and Resettlement Act, 2013 (commonly known as the Land Acquisition Act, 2013 or LARR Act), governs land acquisition and establishes the procedure and rules for compensating, rehabilitating, and resettling affected persons. The Act contains rules that provide just compensation for persons whose land is taken, increases transparency in the process of acquiring land for factories, buildings, or other infrastructure projects, and ensures rehabilitation of those displaced. The Act repealed the British-era Land Acquisition Act of 1894.” (Khan, 2013)
Its objective was to ensure that the land acquisition process is transparent, in consultation with all stakeholders and local governing authorities, to compensate households who have been impacted, whose land has been taken, or whose livelihood has been impacted as a result of the land acquisition. The impact on the Indian real estate market can be studied through a Social Impact Assessment (SIA) study is also required under the new Bill. This study details out how the acquiring parties intend to use the property as well as how the original occupants or owners will be restored. For developers, the cost of land rose dramatically, affecting project costs and, as a result, profits.
Make in India Campaign, 2014
The famous ‘MAKE IN INDIA’ programme, launched by Prime Minister Narendra Modi, began with the goal of transforming India into a manufacturing powerhouse comparable to China. The massive investments projected in the infrastructure sector are likely to benefit the Indian real estate market significantly. According to the 2012 census, India currently has an estimated housing deficit of 18.8 million units in urban areas and 47.4 million units in rural regions. Existing cities’ urban centres will need to be revitalised, while new, inclusive smart cities will need to be built to fulfil the demands of an expanding population and migration from rural to urban regions. (Report, 2021)
Source- (Report, 2021)
The Indian Real Estate saw a reversal, as this sector, which is mostly dependent on the construction industry, will have a considerable influence on shifting demand and investment strategies in the real estate market. The affordable housing industry began to demonstrate substantial growth patterns.
The need for residential apartments for workers in the manufacturing industry also rose. Manufacturing facility growth will result in the development of suburban regions, which will attract investment for residential requirements.
Pradhan Mantri Awas Yojana, 2015

Source- (Report, 2021)
Housing” through a credit-linked subsidy on house loans for persons from economically disadvantaged groups as well as low- and middle-income groups. The plan is funded by both the government and the private sector.
The plan was divided into two parts: PMAY Urban and PMAY Rural. This was further subdivided into four components, which are listed below.
- In situ Slum Rehabilitation-This component is meant for people who live in slums or low-income neighbourhoods.
- Beneficiary Led Construction-This component aids EWS-eligible families who wish to construct a new home or make improvements to an existing home.
- Affordable Housing in Partnership-In this component, a recipient who does not own land or a house and who cannot afford to build one with the help of a home loan may get central assistance of Rs.1.5 lakh for the construction of a new house if he or she qualifies.
- Credit Linked Subsidy Scheme-Those who can afford to construct, acquire, or make improvements to a house with the help of a home loan are the target audience for this programme.
| Category | Required income | Min.loan Amount on which subsidy is calculated | Interest subsidy % | Maximum subsidy in rupee | Max.Carpet Area |
| EWS & LIG | Upto 50k | 6 lakh | 6.50 | 2,67,000 | 60 |
| MIG1 | 50k-1Lakh | 9 lakh | 4.00 | 2,35,000 | 120 |
| MIG2 | 1Lakh-1.5Lakh | 12 lakh | 3.00 | 2,30,000 | 150 |
Source – (Report, 2021)
The impact on Indian real estate market can be seen in the affordable sector which accounted for more than 40% of all residential projects. Also, given the fact that the Union Budget 2018 is expected to offer a significant boost to the affordable housing sector as well as the PMAY, the number of private equity investments is expected to increase this year.
Smart Cities Mission, 2015
The word “smart city” connotes a metropolis with unmatched urban planning, efficient infrastructure, and innovative information technology systems. The characteristics of a smart city includes goals such as decreasing congestion, air pollution, and resource depletion. Additionally, the programme will strengthen the local economy, foster engagement, and maintain security, encourage diversified land use in area-based developments, including the creation of ‘unplanned regions’ holding a variety of appropriate activities.
Given that smart cities are intended to improve people’s quality of life and perhaps even to position India as a global role model, the government is working relentlessly to ensure they are implemented correctly. This would surely provide a significant boost in Indian real estate market. The following impacts can be observed-
- Increased interest in commercial real estate.
- Strengthen public-private partnerships.
- Housing designs that are more accessible and inexpensive.
- Benefit smaller real estate developers.
Demonetisation, 2016
When on November 8, 2016, Prime Minister of India announced ‘demonetisation’ to weed the Black money from the Indian economy, little was known what the implication of such decision on various sectors would be. And in subsequent period when things unfolded, it was quite visible the negative impact demonetisation had caused on the Indian real estate market. It depleted the liquidity in the system and almost destroyed the parallel cash economy.
The year 2016 showed a negative growth 9%. And if we specifically se the fourth quarter of 2016 the sales volumes dropped by 44%. The land prices in land deals plunged 30%-40% from their earlier prices. And the housing supply units in six major cities in the first three quarters of 2017 showed 60% lower supply rate as opposed to the supply in same period in the year 2016.
Real Estate (Regulation and Development) Act, 2016

The Indian real estate market till yet as observed have been growing significantly but it was unregulated and lacked transparency. There were delays in property to buyers, homebuyers were misled regarding property details. Other problems included stepping beyond permissible FSI, lack of standardization and consumer protection etc. All these shortcomings in the Indian real estate market led to the formation of Real Estate Regulation and Development Act, which is referred as RERA in the year 2016.
Also read: Invest in the Indian stock market
It seeks to increase builder responsibility to stimulate Indian real estate market investment and provide a more transparent environment for home purchasers. RERA had a huge impact on business model and partners.
Some major changes that RERA bought were:
- Promoter – It increased the responsibility and compliances of promoters involved in a particular project.
- Liquidity – Cash flow planning
- Registration – Project Registration with RERA
- Sales & Marketing – Increase in the project launch time
- Operational Transformation – Project Management, Design, Sales and Marketing
Looking at the impact of RERA, it can be seen it impacted the entire market heavily. Seeing the sales trend, it is observed that the relationship between the units launched and sales have changes over the years. In Figure it can be seen that new launches dropped drastically after 2016 and also in the start of 2017.

(ANAROCK , 2018)
Case Study 2: Effect of Demonetisation and RERA on Bangalore
Now to better understand the effects of demonetisation and RERA in metro areas let’s look at a case study on Bangalore. Where we will see how these two policies changed the real estate market in Bangalore. Let’s first understand the real estate market of Bangalore. The micro market of Bangalore is divided in 5 regions i.e., North, South, East, West and Central. These division of micro markets is represented in Figure and now let’s understand each sector separately.

(ANAROCK , 2018)
Central Bangalore
In comparison to other parts of the city, the supply of new units in the central zone is modest. This is primarily owing to the city centre’s high land prices and scarcity of land. Most places are already developed and saturated, with little room for expansion. However, a few major redevelopment projects are generating some residential operations in the area.
Fresh supply peaked in 2014-15, according to data, but dropped following Demonetisation and the adoption of RERA in 2016. The supply of new units in CBD is restricted, with the ultra-luxury tier seeing the most releases, followed by the mid segment.

(ANAROCK , 2018)

(ANAROCK , 2018)
East Bangalore
East Bangalore has seen the maximum amount of new unit supply. The reason behind this is because of the high concentration of IT businesses and land parcels for future construction are readily available. The price segment that is prevalent in the property spectrum over here as seen in the Figure , is the mid category i.e., between 40 Lakhs to 80 Lakhs.
Now, if we see the same figures of supply and absorption after the announcement of RERA and demonetisation, we can see a sharp decline in the overall market Figure 25.

(ANAROCK , 2018)

(ANAROCK , 2018)
West Bangalore
West Bengaluru has seen a low supply of new unit’s supply comparing with the other zones. Also, this micro market houses educational institutes and industries. The budget segment of 40lakhs to 80 lakhs was the highest as per Figure 28.
(ANAROCK , 2018)
And if we look at the supply and absorption rate here it is observed that the supply of new housing stock reduced from the year 2016 onwards and the figure of unsold inventory has also increased.
(ANAROCK , 2018)
North Bangalore
North Bangalore also shows a similar trend as other micro markets in Bangalore. This area has gained a significant growth in the last few years. Here, the change in number of housing units is pretty evident from the Figure as it shows an enormous dip in the supply of new housing units and this figure also shows a vast number of unsold inventories in 2016 and then in the subsequent years.
(ANAROCK , 2018)

(ANAROCK , 2018)
South Bangalore
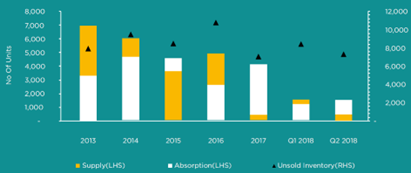
If we look at south Bangalore it is the second highest micro market in terms of supply of new housing units. Once again, the reason being the availability of large land parcels for future developments. Here, also the supply of new housing units took a hit in 2016 as is seen in Figure . This figure also shows the that the supply was recovered in the year 2017 but still there is a large amount of unsold inventory.

(ANAROCK , 2018)

(ANAROCK , 2018)
Now in conclusion “Reformatory changes including Demonetization, RERA and GST by the central government led to large-scale economic transformation in 2016-17. Implementation of these initiatives brought in the much-needed transparency, accountability, efficiency, and financial discipline within the real estate sector.” (ANAROCK , 2018) This downfall can be seen in the Figure , where both the supply and absorption of housing stock came to major low. Despite this the prices of properties remained stable which was not the case in other metro cities.
While Demonetizations “impacted the real estate sector by restricting the movement of cash, among the major teething issues of GST there was lack of clarity which ultimately kept home buyers away from the property market. Moreover, buyers went in a wait-and-watch mode in anticipation of price corrections. Meanwhile, RERA brought in the much-needed respite for several home buyers who had been suffering due to the unscrupulous activities of few developers.” (ANAROCK , 2018)

(ANAROCK , 2018)
Extension in project Registration amid COVID-19, 2019
During the COVID-19 pandemic major delays were observed due to the unseen policies that were imposed in India during its initial outbreak. Over 20 states had provided an extension period of around 6-9 months for the registration of real estate projects.
There was a large-scale migration of people working in the construction industry and market supply chain saw a great disruption, and these factors adversely impacted construction works. During COVID many developers were not able to obtain permit for new projects and had to face construction delays and stoppages that were shrinking rates of return for their investment.
Conclusion
The table below gives an overall understanding of the impact categorized into three parts- Positive, Negative and Both of different development policies on Indian real estate market.
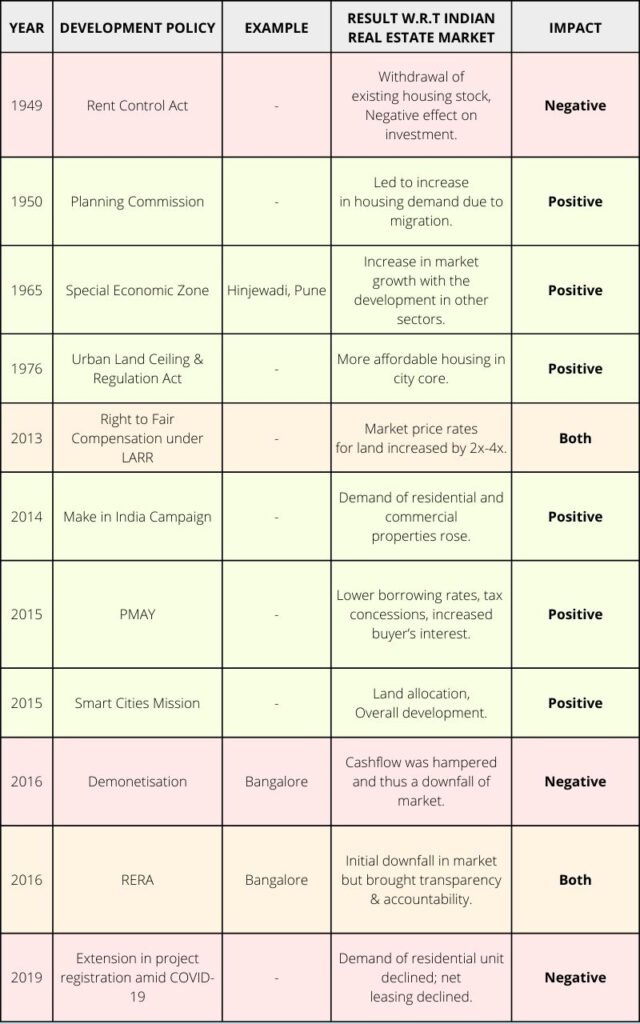
Table gives us an overview of the impact of development policy on various constitutes of Indian real estate market market such as the housing sector, land property, financial factor, etc.
From the foregoing discussion, it can be concluded that while many policies had an adverse effect on the market, these initiatives provided the real estate sector with much-needed transparency, responsibility, efficiency, and fiscal stability. After a triple shock of demonetisation, RERA, and GST in 2016, the Indian real estate market took a hit. Due to a lack of clarity among stakeholders on how to handle the problem, growth in this sector was only observed after 2018. It is anticipated that the value of the Indian real estate market would have increased to one trillion dollars by the year 2030. By the year 2025, it will make up 13 percent of the total GDP of the nation.
Thus, it can be finally concluded that even though the Indian real estate market is experiencing a boom, it is still in its infancy and is still dominated by undercapitalized regional and family-run businesses.