
Rural-urban fringes are often subjected to ambiguous behaviour in terms of landuse. In rurban areas, the boundaries between different areas are hard to delineate. Sometimes a mixture of different communities with variety in income group, cultural identity or ethnicity can be found. Cities have developed to the extent that residents from surrounding areas occupy these fringe areas. The lack of regulations and controlling measures causes unbound development in such areas.
These development have a significant impact on the economy which in turn affects the social fabric of the area. The communities residing in the fringes often have incompatibility issues which cause conflicts regarding the use of the land. Uneven distribution of land ownership intensifies the development in certain hotspots which culminates in gentrification. This has creatively generated contemporary uses of land highly focused on operating for commercial purposes.
Rural-Urban fringe
L. Smith’s discussion of the “urban fringe” coined the term around Louisiana in 1937 marked the first use of this term signifying “the built-up area just outside the corporate limits of the city” (Smith, 1937).
Robin Pryor argues, “A rural-urban fringe can only exist between a growing urban centre and its rural hinterland, so it is no diminution of the concept to view it as the residual zone between two more readily defined poles. Characteristics of the fringe need not be intermediate nor on a continuum between rural and urban, yet distinctive location and internal heterogeneity”(Pryor, 1968).
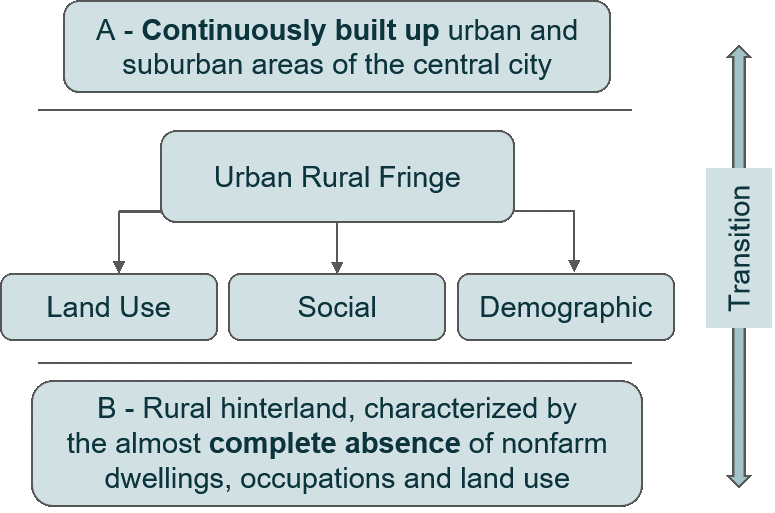
So it’s a zone of transition in 3 aspects of land use, social & demographic characteristics lying between A & B. Where A and B are as shown in Figure 1: ‘Defining the rural-urban fringe’.
Next, we are discussing some definitions and delineations from them.


Rurban: Rural + Urban
Rurban refers to a land which has an urban way of living within a rural context.
“Rurbanization” (Galpin, 1918) concept may vary with context with differences in understanding as to the land use also varies.
Case studies
An Israeli case study
For the understanding impact of urbanization on the difference in land use in the fringe area between rural-urban regions, a case study from Israel is presented. In rural Israel, you will find such settlements which are commonly known as ‘Moshav type settlements’, since the 1950s.
Average Moshav contains 60-100 families & land allocated to each farm unit varies in terms of physical characteristics ranging from 3 to 15 hectares & there are certain principles on which they are based.
- The state owns the land.
- The fundamentals of production start with the basic unit of the family farm.
- Establishment of an organization for handling commercial activities.

Now the growth is irregular and to some extent, there is an encroachment of the urban region toward the rural region. Combinations of industrial and commercial land uses are observed resulting in the modernization of various croplands (Clouser, 2005).
Although there was an increase in the rural population of Israel, its share employed in agriculture has declined significantly over the last three decades.
Restructuring after ‘the financial crisis’
Earlier planned rural settlements were based on particular principles and all the economic operations were based on agriculture. Their contribution was well recognised and they were receiving institutional support from national authorities.
‘The financial crisis of 1980’ is said to be the turning point and the institutional protection for agriculture was removed by the government. This resulted in the process of restructuring, where characteristics of the developed economy were seen.
Chronological updates in land-use
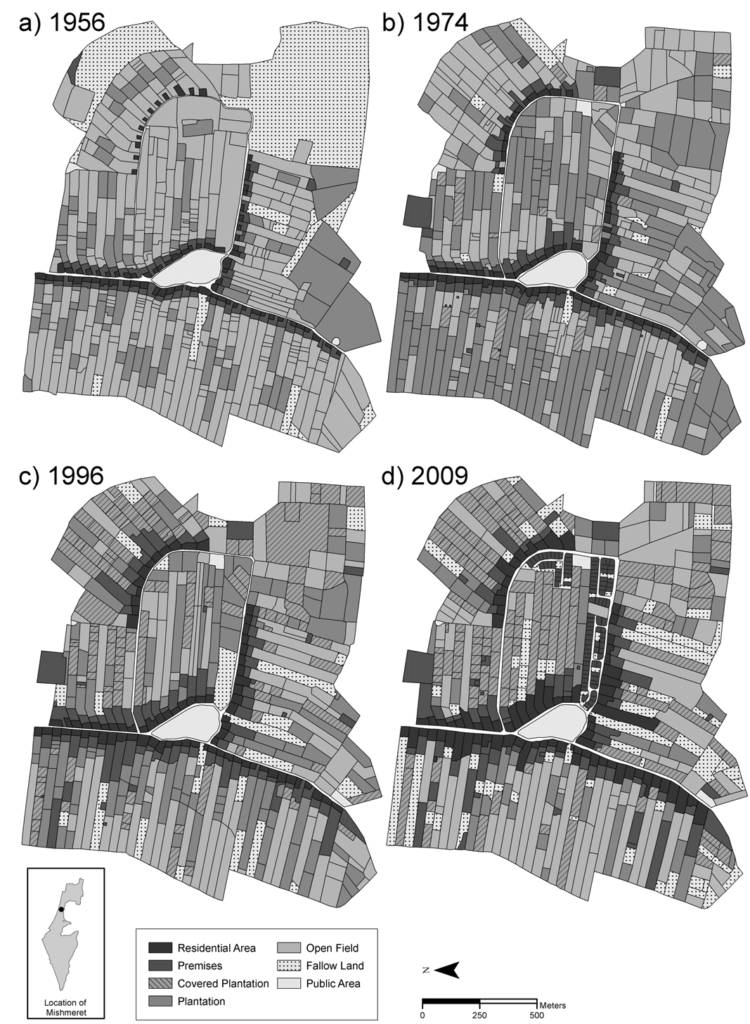
Mishmeret Moshav
The following figure shows the evolution of Mishmeret Moshav with respect to time. As we observe year-wise, we can see the land use colours are getting darker i.e. more residential areas are developed in the premises whereas open lands and fallow lands are reducing in area. At centre, there is a public area where common activities are held.

In Mishmeret, new developments such as luxury home schemes and organic farm resorts started coming up.
Nir Yisrael Moshav

In the graph for Nir Yisrael, you can see for land use for ‘residential area a’ and ‘residential area b’ there in increment with respect to time for both of the areas. If we compare aerial views of the moshav with respect to time, development is prominently seen. For e.g. Vacation rentals are recently been coming in place of agricultural lands.
Megadim Moshav

The third example is Megadim moshav and it also follows the somewhat same trend of increase in residential areas which are majorly vacation rentals.
Comparison of Land Use Changes
General results have been common for Nir Yisrael and Megadim. So looking for Mishmeret, the earlier settlement from 1940-50 decade, equal plots of land can be seen side by side. If we extend further out we can see farmlands. Communal gathering space at the centre is a significant feature of every moshav which is seen in this case also. Around 25% of the land was cultivated with plantations keeping the northeast and southeast lands of the moshav unused. So agricultural income was the predominant source of income during the 1950s.
With the rise in the standard of living, during 1974 major changes are observed in the land use pattern of Mishmeret. Due to the increase in capital intensity in a market, a significant rise of covered plantations such as greenhouses, which can be confirmed as the unused land is rare. This was possible as a higher capital investment in farming intensified production. On the map of 1996, residential land accounted for a larger share of the land use.
Read more: Integrating climate projections with spatial planning practices for sustainable urban development
Agricultural Dynamics in Belgium
Basic Reason for Urbanisation in farmlands
The investors that invest in the urban fringe are mainly for future development possibilities. The farming land receives much attention in order for them to be used in different ways such as leisure activities.
“Horsification” is a term used for using land for hobby horse keeping which is more than one-third of the grasslands of Belgium known as Flanders.
New locations can be easily found in the rural-urban fringe rather than the high rent and high density along with lack of space in the city for commercial, industrial and other such activities.
Alternative farming methods have been developed due to the presence of a nearby city which impacts how the farming can be done by introducing new ways.
Alternate uses for farming lands
Alternative uses of farmlands are significantly impacting the landuses in terms of agricultural activities where material storage facilities, garages, fitness and wellness centres, restaurants and farm tourism covers almost 20% of the farming area.
Growth of Belgium
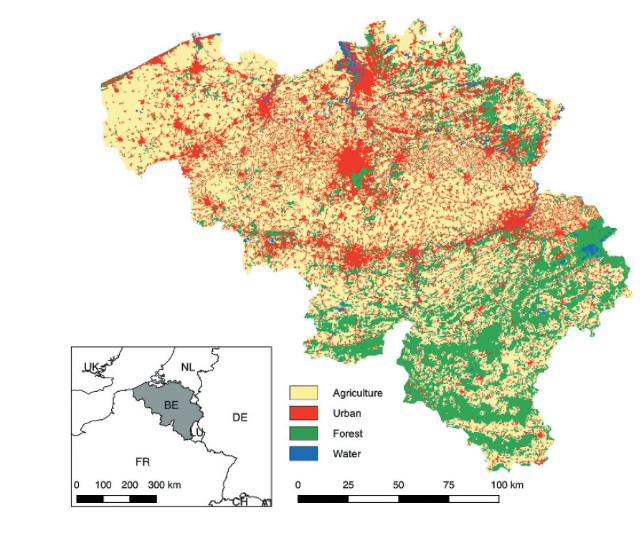
The famous grasslands of Belgium known as the Loam region and the Polders are the areas with most agricultural activities.
In the 19th century, major growth and development took place in Belgium due to the flourishing nature of commercialization. The cities were majorly secluded from their neighbouring areas. Compact housing in the city due to the increase in the urban population led to the rapid urbanization past the outskirts of the city.
The shifting of the rich to the greener outskirts of the city due to the unhealthy and densified environment led to greater development in the fringe areas. This led to the overall decrease in the density of the city. In the post-war scenario, the boundaries between the cities started to decrease. A strong fragmented landscape can be seen forming due to greater urbanization on the urban fringes.
Land-use Data
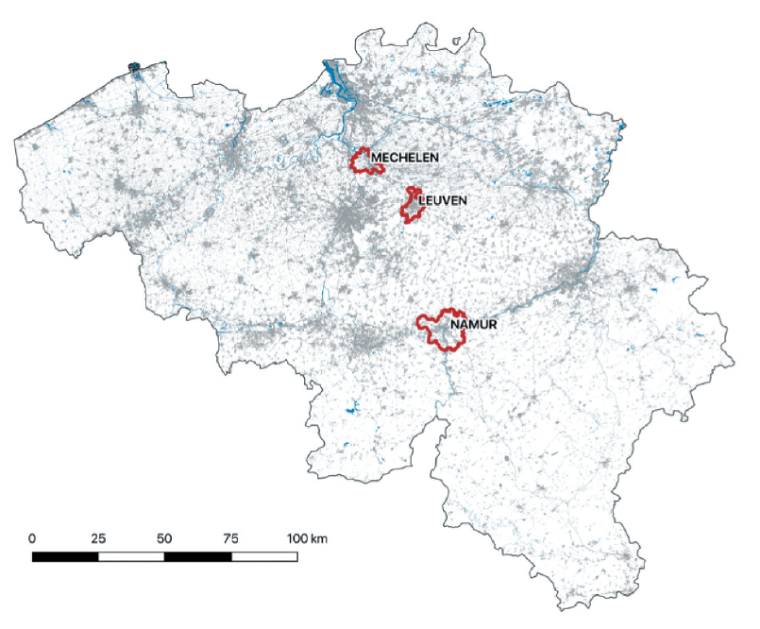
As seen in the map most of the agricultural activities are found in the central, also known as the Loam region, and the northwestern part of the country, also known as the Polders. Urbanisation can also be seen in those parts, as development happened alongside. In the southern region, the forest region can be found.
Agricultural Regions
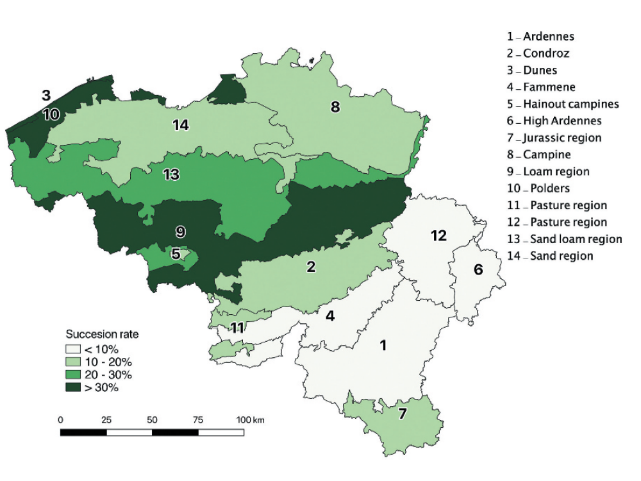
A maximum succession rate of more than 30% can be seen in the previously mentioned regions of Loam and Polders. These regions are the core of agricultural activities.
A succession rate of less than 10% is seen in the forest area in the southern part of the country.
Farmer Statistics
Ribbon development in the peri-urban zone can be considered a major factor in the increase in the built-up area of Belgium. The updated policies and interventions for the farmers create a lot of restrictions in the farming practices which include lower marginal costs in the global market and environmental policies and implications which have to be considered while farming. This resulted in overall harder farming management and hence a reduction in the farming practices overall in Belgium.
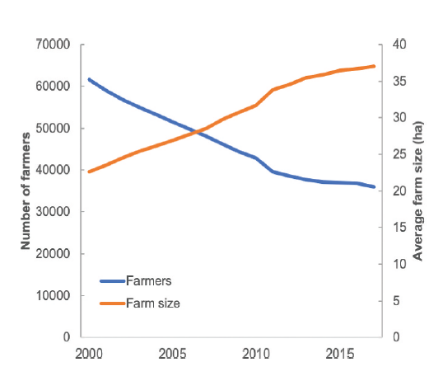
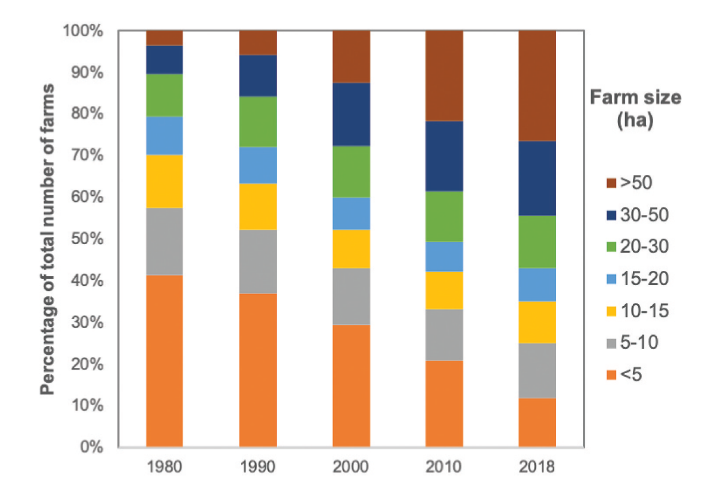
Figure 9 shows that most of the farmers don’t find a successor at the retirement age which is less than 30%. The number of farmers can be seen falling drastically in the less fertile northern sands and the southern soils. Between the period of 1980-2015, the number of farmers decreased by 70% on the national scale. Since the area of agricultural land remained constant, an average increase in the farm size can be seen during the same period.
Data & methodology
A method was developed called the two-step methodology where the existing storylines based on the future of urbanization were studied.
Then the appropriate storylines were selected to study the impact on the urbanization level of individual farms, based on the discrete models to model the farms on individual levels.
Storylines
Before coming to the storylines I want to mention the EU-CAP which is the European Union Common Agriculture Policy which is used to control the regulations regarding agricultural supply and demand.
Coming to the storylines, there were mainly four storylines considered:
- the Strong Europe (SE) storyline
- the Global Economy (GE) storyline
- the Regional Communities (RC)
- Transatlantic Market (TM) storyline
The storylines were combined and refined with respect to a “Business-as-usual” (BAU) storyline. This storyline takes into consideration the current trends of census growth and density with a combined intervention of no changes in the agricultural policies on the local farming implications or in EU-CAP.
Overview of different storylines
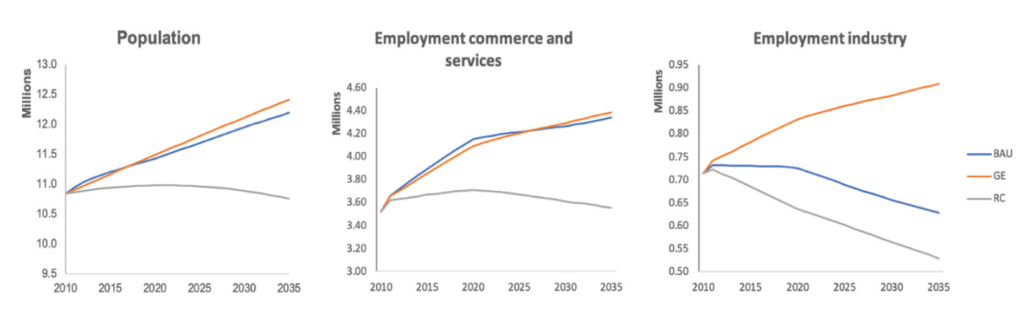
In the last, only three storylines were considered. In the BAU storyline, the continuation of current trends of demography in relation to the same subsidy level is considered.
In the GE storyline, economic prosperity with reduced commercial barriers and no government involvement and a decrease in subsidy.
In the RC storyline, there was reduced global trade and attention to communal and environmental strategies with short-chain markets were considered.
Different Levels of Land-use
Inputs for the models were considered from the acreage studies. This model is known as the CCA model which was based on three levels.


Results
Increased urbanization in the country can be seen in all three scenarios for the projected the year 2035. The results were for three medium-sized cities Namur, Leuven and Mechelen with each around 100,000 inhabitants.

Urbanisation in Regions: A closer look
The highest urban expansion is seen in cases of the BAU and GE scenarios. They show a spread of currently located urban regions along the arterial and sub arterial roads. This is commonly known as urban sprawl. Whereas, the increase in the urbanized areas is minimum in the case of the RC scenarios. Recursive urbanization results in increase in the density of existing urban centres.

Impact on Agriculture
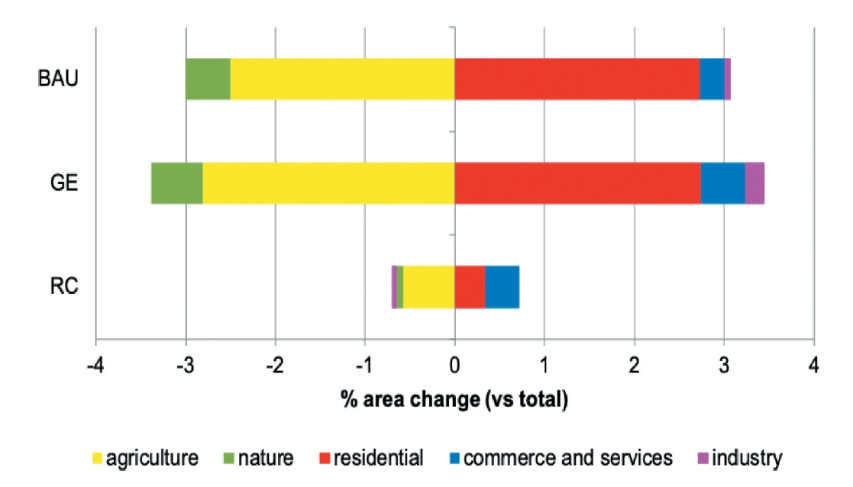
Talking about the impact of urbanization on agriculture from the data that we can see in the following chart.
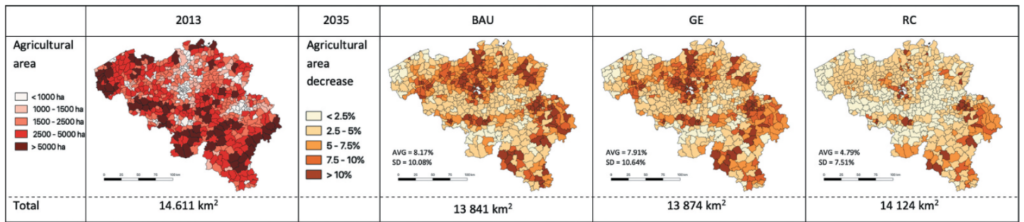
It can be seen that there is a decrease in farmland under various scenarios due to rapid urbanization. More than 10% of the land is lost which falls under the agricultural area This can be seen in the central north areas of the country. The Flemish Diamond area consisting the four cities of the greater Liège area in the east.
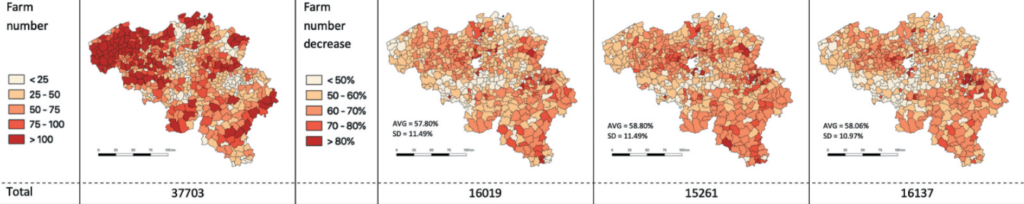
More than 50% of the farmers can be seen dropping by 2035 in Figure 18. The largest loss can be seen in the south and the northwest of the country due to the less fertile regions. In the central part, the highly fertile region can be considered as a reason for the number of farmers being very high. Loss in the number of farmers in the eastern part of the country can be seen as a culmination of all these processes. There is an even sudden drop in the number of farms due to the urbanization pressure and the low succession levels around the city of Liège.
Read more: Urban floods – Impacts of Climate change vs Urbanization
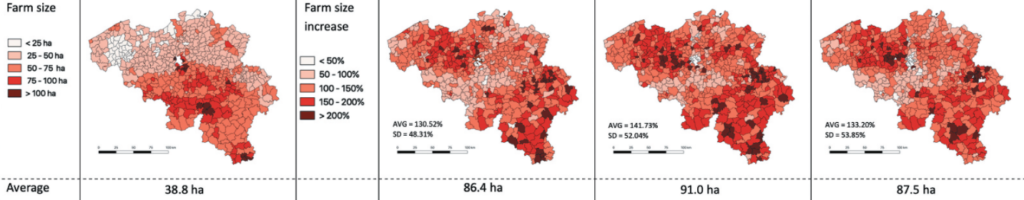
The decrease in the number of farmers results in an increase in the farm size. The biggest farm size is 91 ha which is achieved in the GE scenario, which is more than the BAU with 86.4 ha and RC with 87.5 ha farm size. A decrease in the big farms in the GE storyline with higher farmer dropout rates can be seen. The same can be seen in the case of the BAU storyline but in this case, there is a lower dropout rate of the farmers which results in a smaller farm size.
Indian context from the case of Patna
Regional setting- Patna

It is an example of a linear pattern of cities in India in the north it is bounded by the river Ganga, the flood plain of the river Punpun in the north, the flood plain of the south-west of Dinapur and Khagaul in the west and the confluence of river punpun with Ganga near fatwah in the east.
The city of Patna is located on the natural level of the river Ganga. The higher land runs in an east-west direction on the southern bank of the river Ganga. The river is a great barrier to its expansion in the north, while the Punpun flood water becomes an obstacle in its southward extension.
The low land to the south and almost parallel to the natural levee of the river Ganga and it is generally sloping to what towards the East.
Hence the city has not been able to develop beyond the Ireland of the levee. So it is developing in a linear pattern.
The Patna agglomeration includes

The Patna agglomeration includes:
a)Patna municipal corporation
b)Patliputra Housing cooperative society
c)Phulwari
An urban centre is a dense agglomeration of people with an organised administrative set-up. Where less than 25% of the total working group is engaged in primary occupation and which is characterized by at least one urban function. Such as trade, transport, manufacturing, or professional and administrative services.
Two separate zones
(i) Outer fringe
(ii) Inner fringe

In the case of Patna’s fringe, part of the diary land across river Ganga in the north comes within the outer fringe. The ferry service links the areas and helps in the transport of goods from the fringe to the city.
The bridge forms an elongated belt due to the location of the city on a natural levee. The city is not able to extend towards the south on account of the low lying tract.
Here the fields are intensively the size of landholding is very small the portion of cash crops has increased it is very small, the production of cash crops has increased and the pressure on the land has declined.
All these are a sign of outer fringe development. In the inner fringe zone, the density of population is higher, the commuting population is also so high and the area is densely built-up.
Thus, the distinction between the two is enough to justify their identification as two separate fridge zones.
Fringe Characteristics
Patna Fringe are characterised by some reasons: –
- Roads and Street.
Roads and streets in Patna’s fringe are characterized by an overflow of drain water. They are generally in a bad condition. Insanitary conditions in the fringe area are the main cause of different types of the disease since there is no piped water supply.
- Medical facilities.
Medical facilities too are not adequate in the fringe area. Qualified doctors are reluctant to live away from the town centre. The fringe dweller will not go to the area for medical services.
- Chemists and Druggists.
The same applies to chemists and druggists. Thus the conditions deteriorate in the area just adjacent to the city border.
- Transport problem.
The transport problem is magnified in the fringe area because the condition of roads is bad due to overflow of drain water onto the roads and a lack of public transportation.
- The insufficient number of markets.
There are an insufficient number of markets in the fringe area. There are very few shops in comparison to the number of consumers. As such prices are unbridled and the consumers are badly fleeced. Even ordinary goods are not available in the fringe area.
- Education system.
So far as education is concerned, there are very few high schools and colleges. Fore college to University education it is incumbent on the student to either commute to the town or live there.
Administrative office
- Dinapur – cum – Khagaul
- Phulwari Sharif
- Patna rural A & B
- Punpun
- Fatwah
- Raghopur
- Sonepur (circle office)
This is a common feature in all urban fringes. What is more interesting, the local villagers call the residents of this area share, that is urban while the town dwellers call them that or rural. Thus the reason is not integrated with the neighbourhood.
At present, the population of Patna is increasing at a rate of 1.35 % per year. 7.2 persons live in a house in Patna in 1971 as against 16.8 persons in 1961.
This shows that the pressure on housing facilities is necessary. An expansion of the fringe belt will take off some of this pressure with the expansion of a city and the Fringe is absorbed into the town.
If the fridge belt is unplanned, the pressure of the population soon turns it into a slum area. An expansion of the town that covers the slum area leads to a great problem for the live authorities. Such as already Patna’s fringe in phulkari Sharif, Sabbalpur and parsa Bajar are deteriorating into slums and if these are being absorbed in the city of Patna at a later stage there will be great difficulty in their development.
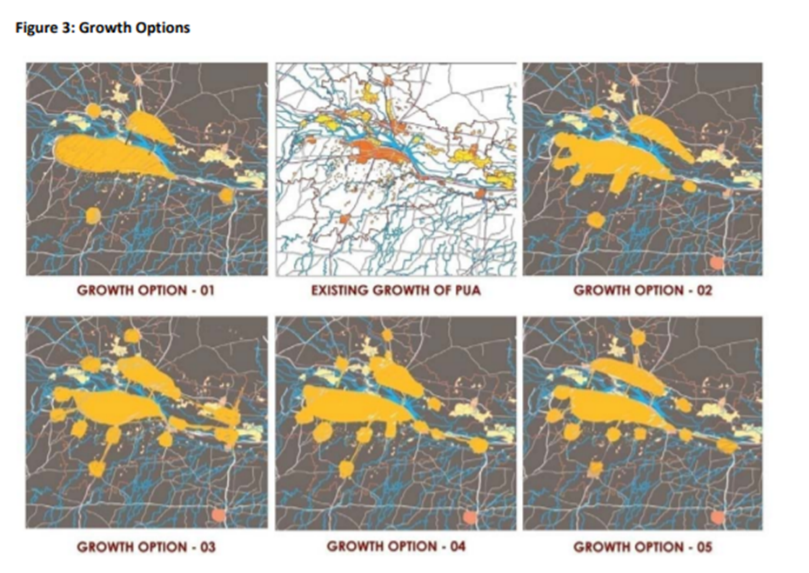
Growth of Patna
The fringe of Patna generally developed in phases. With the expansion of the city, the inner will be swallowed first. Then the outer fringe will take the position of the inner fringe and the stretch of the rural area outside the outer fringe boundary accordingly so that the expansion of the city will not be burdened by the defective economic, social and cultural characteristics of the fringe area.
Concerns due to uncontrolled development
Various concerns have come up due to such uncontrolled developments which can be majorly categorised in 3 columns.
- Practical:- We are wasting time commuting, there is a loss of prime farmland and to some extent inability to provide cost effective-public services.
- Social:- The pattern is encouraging social exclusion which is a major concern. Whereas atomization of family life is increasing.
- Aesthetic:- In peri-urban growth, there is a loss of valuable countryside, as well as sterility and uniformity of low density.
Controlling Measure
To tackle the above problems there have been some controlling measures for urban containment strategies. Where ideas were expressed by Thomas More, Robert Owen & Ebenezer Howard who coined ‘Garden city’ in 1898. Their aim was town and country should be functionally related but physically distinct. Then there are some Japanese terms related to this referred to as ‘Urban Promotion Zone’.
Now Garden city was implemented to some extent I Greater London Plan in 1945. A tight urban development limit was enforced by the regional plan, beyond which a large swath of land was designated as a green belt, with development severely restricted. The plan was substantially effective, because of highly stringent growth control regulations that barred all forms of right development, and the greenbelt idea was extensively imitated in the United Kingdom and others.
Conclusion
Some of the driving forces of the development of fringe areas can be outlined as follows.
(i) Population Increase- There is a continuous influx of people to urban areas in search of livelihood They are often engaged in non-formal jobs and do not have a place to live in urban areas. Fringe is giving them solace as they can stay along roads outside the margins of the city.
(ii) Increased Income and wealth.- An increase in income has brought about changes in lifestyles. The rich prefer living on the fringe with an improved lifestyle.
(iii) Transportation and communication technologies – The development of transport has helped expansion and has helped rural people to move off their farms and also the city people to be dispersed to surrounding suburbs.
(iv) Increased investments in new infrastructure.- There has been a manifold increase in the city’s function as a result of which retail houses, warehouses and other commercial development has taken place and employment to relocate labour forces. The urban fringe has developed but it is underdeveloped.